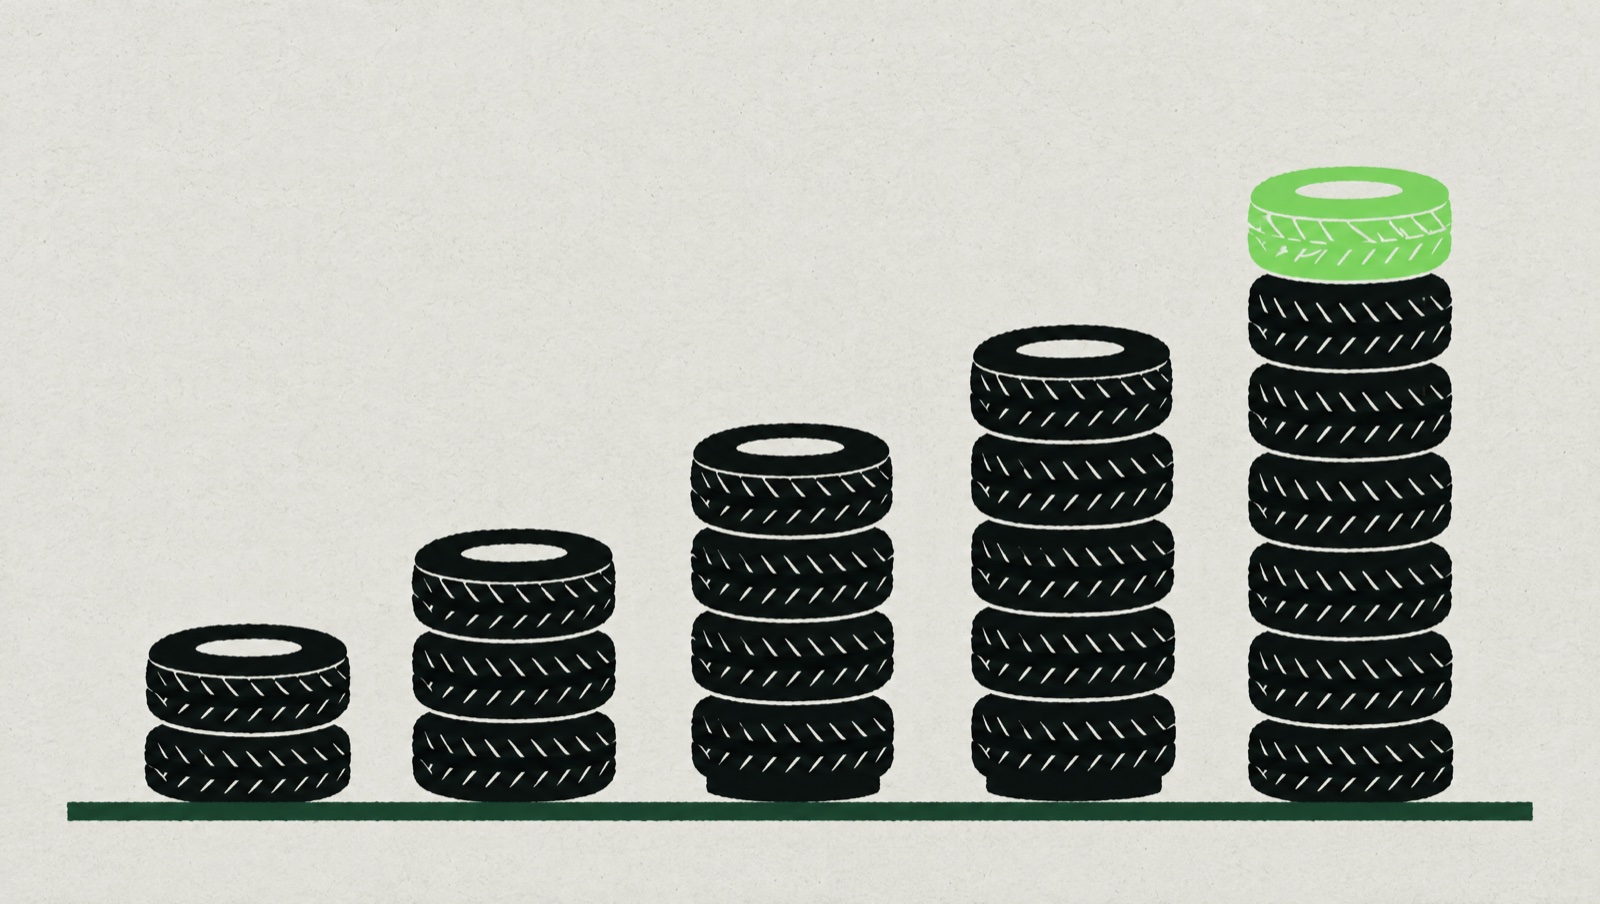
The UK supplies nearly a fifth of India's waste rubber imports
Indian customs recorded 409 kt from the UK in 2025-26, second only to the United States. England's export checks recorded 17.66% of shipments as non-compliant by August 2026.
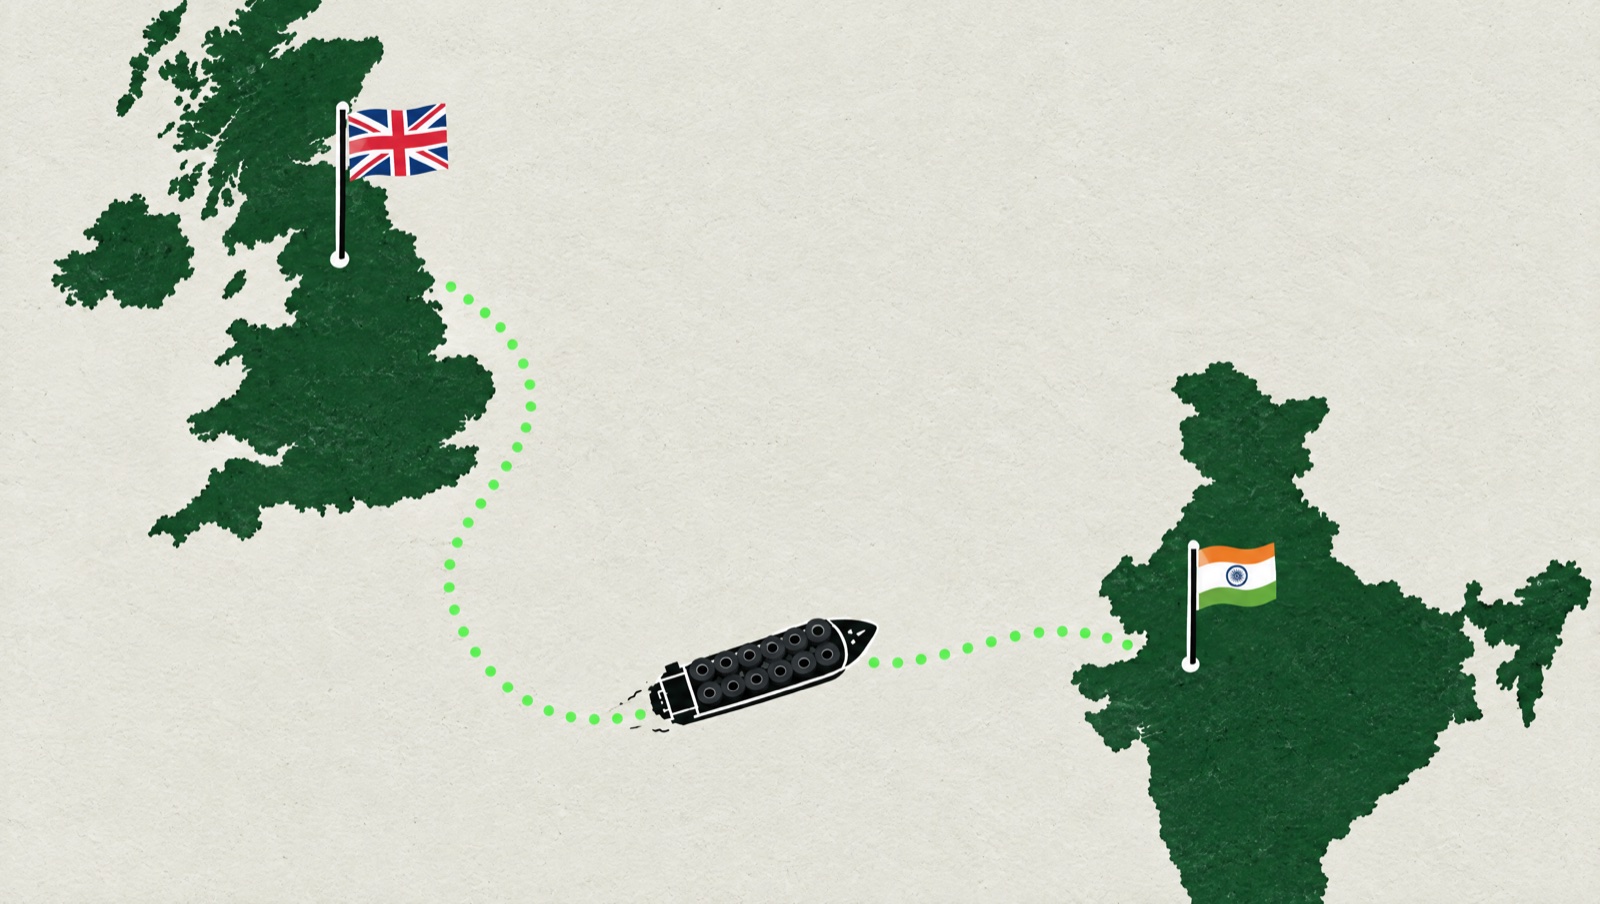
This is Datalysis analysis: our data joined with the sources linked under each chart. Our own calculations are marked est., and our interpretation is in its own section. Data as of 9 Nov 2026.
One of India's two largest sources
India's customs statistics recorded 409 kt of rubber waste and scrap arriving from the United Kingdom in the fiscal year 2025-26 (April to March), the second-largest origin after the United States (611 kt). Across all 55 origins the recorded imports add up to 2.19 Mt, so the UK accounted for 19% of the total, against 21% in 2024-25.
The UK was India's second-largest source of waste rubber in 2025-26: 409 kt, 19% of recorded imports
Indian imports of rubber waste and scrap (HS 40040000), by origin, kt, fiscal year 2025-26  est.
Note: Top 8 of 55 origins. Share: UK tonnes divided by the sum of all origins (2.19 Mt), our calculation. HS 40040000 also covers rubber scrap that is not tyres; the statistics do not separate the two.
Source: India, Ministry of Commerce and Industry, DGCI&S Export Import Data Bank (HS 40040000) · Data as of 9 Nov 2026

The UK's own export figures point the same way. In the extract the Environment Agency published with its 2025 review, exports of waste rubber (HMRC code 4004, mostly tyres) to India were 363 kt in 2023 and 386 kt in 2024. The two countries count differently (calendar against fiscal year, exports against imports), so the figures do not match exactly, but each side's latest year is higher than the one before. Each side publishes only two comparable years, so this is not yet a long trend.
Both sides record 363 kt–409 kt a year of waste rubber going from the UK to India
Waste rubber from the UK to India, kt a year, as each side reports it
UK exports to India, HMRC code 4004, calendar years
Indian imports from the UK, HS 40040000, fiscal years
Note: Two separate measures, shown apart on one scale: the UK counts exports by calendar year, India counts imports by fiscal year (April to March), so their years overlap and should not be read as one series.
Source: Environment Agency, Appendix 4.8: exports of HMRC code 4004; India, Ministry of Commerce and Industry, DGCI&S Export Import Data Bank (HS 40040000) · Data as of 9 Nov 2026
What England now checks
Since 1 October 2025 the Environment Agency has carried out enhanced checks on exports of waste tyres from England. For India, exporters must show that the receiving recovery facility works to standards broadly equivalent to the UK's. By its January 2026 implementation plan, the agency had served information notices on 42 exporters, accepted 41 Indian facilities and rejected 13; movements to the rejected sites are now prohibited. It had received 1,093 waste movement forms.
Its August 2026 update, with data to 3 August, counts 10,822 shipments reported under the checks, of which 5,819 had passed the 16-week deadline for evidence of arrival. The agency records 3,837 shipments as fully or partially compliant (62.12%) and 1,091 as non-compliant (17.66%). Full compliance rose from 7.25% in early May to 15.67% on 3 August. “There is still more to do,” the agency writes.
One caution on these figures: the percentages are not shares of the 5,819 shipments due (3,837 would be 66% of them). They match a base of about 6,180 shipments that the update does not explain, so we show them exactly as published.
England's checks recorded 17.66% of waste tyre shipments as non-compliant; 15.67% were fully compliant
Waste tyre shipments from England, checks on evidence of arrival, % as published by the Environment Agency, to 3 August 2026
Fully compliant shipments, % as published
Note: Shares as the agency publishes them (3,837 and 1,091 shipments); the update does not say what they are shares of, and they do not match the 5,819 shipments due. The rest (20.22%) is our subtraction est.; the agency says some shipments recorded with insufficient or no evidence may already have evidence waiting for review.
Source: Environment Agency, Progress update (August 2026) · Data as of 9 Nov 2026
England has rejected 13 Indian facilities and served 26 prohibition notices on exporters
Enforcement of the waste tyre export checks, counts, January and August 2026 updates
Actions against exporters, to 3 August 2026
Note: Facilities: January 2026 implementation plan; each square is 1% of the 54 facilities. Actions: August 2026 progress update. From 1 August 2026 exporters report each month's shipments by the 21st of the following month, until digital waste tracking starts in 2027.
Source: Environment Agency, Progress update (August 2026); Environment Agency, Implementation plan (January 2026) · Data as of 9 Nov 2026
What India allows
Every Indian importer of used tyre scrap needs a permission from committees of the Environment Ministry, and India banned imports of waste tyres for pyrolysis in July 2022, as the Environment Agency notes in its plan. Adding up the tonnes the committees cleared in each decision, India permitted 2.3 Mt of imports in 2025-26 (227 decisions), against 1.91 Mt in 2024-25. In 2025-26 the most tonnes went to importers in Gujarat (884 kt), Maharashtra (510 kt), Haryana (231 kt).
India cleared 2.3 Mt of used tyre scrap for import in 2025-26, 20% more than a year before; recorded imports grew as fast
Used tyre scrap, India: import permissions and recorded imports, kt, fiscal years (April to March) est.
Note: Permissions: sum of the tonnes recommended in each published committee decision, our calculation; they are permissions, not tonnes imported. Recorded imports: sum of all origins under HS 40040000, which also covers non-tyre rubber scrap. Both cover all origins, not only the UK. 2026-27 is left out while it runs: 1.88 Mt cleared in decisions to 28 Sept 2026.
Source: India, Environment Ministry Expert and Technical Review Committee decisions (latest: 159th EC); India, Ministry of Commerce and Industry, DGCI&S Export Import Data Bank (HS 40040000) · Data as of 9 Nov 2026
Our reading
Three things stand out to us. First, there is no sign yet in India's statistics that the flow has shrunk. The latest full year, 2025-26, includes the first six months of England's checks, and India still recorded more from the UK than the year before (409 kt against 391 kt). The UK's own figures end in 2024, before the checks began.
Second, England's checks now reach the individual Indian site. Exports may only go to facilities the agency has accepted, and the evidence it asks for is shipment by shipment. On its own figures, though, full compliance stood at 15.67% on 3 August, so for most shipments the evidence is still incomplete.
Third, India's permissions and its recorded imports grew at the same pace from 2024-25 to 2025-26: permissions by 20%, recorded imports from all origins by 20%. The two measure different things, so we do not read one as a share of the other, but they move together.
How we made this
- Indian imports by origin: DGCI&S Export Import Data Bank, HS 40040000, quantity, fiscal years (April to March); published in kg, shown in kt. The total across origins and the UK share are our sums.
- UK exports: the Environment Agency's extract of HMRC code 4004 exports to India (Appendix 4.8 of its 2025 review), calendar years.
- Shipment checks and enforcement: quoted from the Environment Agency's January 2026 implementation plan and August 2026 progress update, percentages exactly as published. The rest of 100% in the compliance chart is our subtraction.
- Import permissions: 1,148 published decisions of the Environment Ministry's Expert and Technical Review Committees, January 2021 to September 2026, read one by one; tonnes recommended per decision, summed by fiscal year. Permissions are not imports.
Sources: Environment Agency, Progress update (August 2026); Environment Agency, Implementation plan (January 2026); Environment Agency, internal review and updates (GOV.UK), and the sources under each chart. Found an error? Tell us; corrections are published.
Get the market brief
New analysis and the latest market news. Free, every two weeks.
The importers, permissions and trade flows behind this analysis are in the platform, importer by importer. Join the waiting list